Posted on April 8, 2026 · By Echoes of Kin Genealogy
Understanding centimorgans, shared DNA, and what those numbers really mean for your family history
I remember the first time I stared at a DNA match list and thought, “Well… now what?”
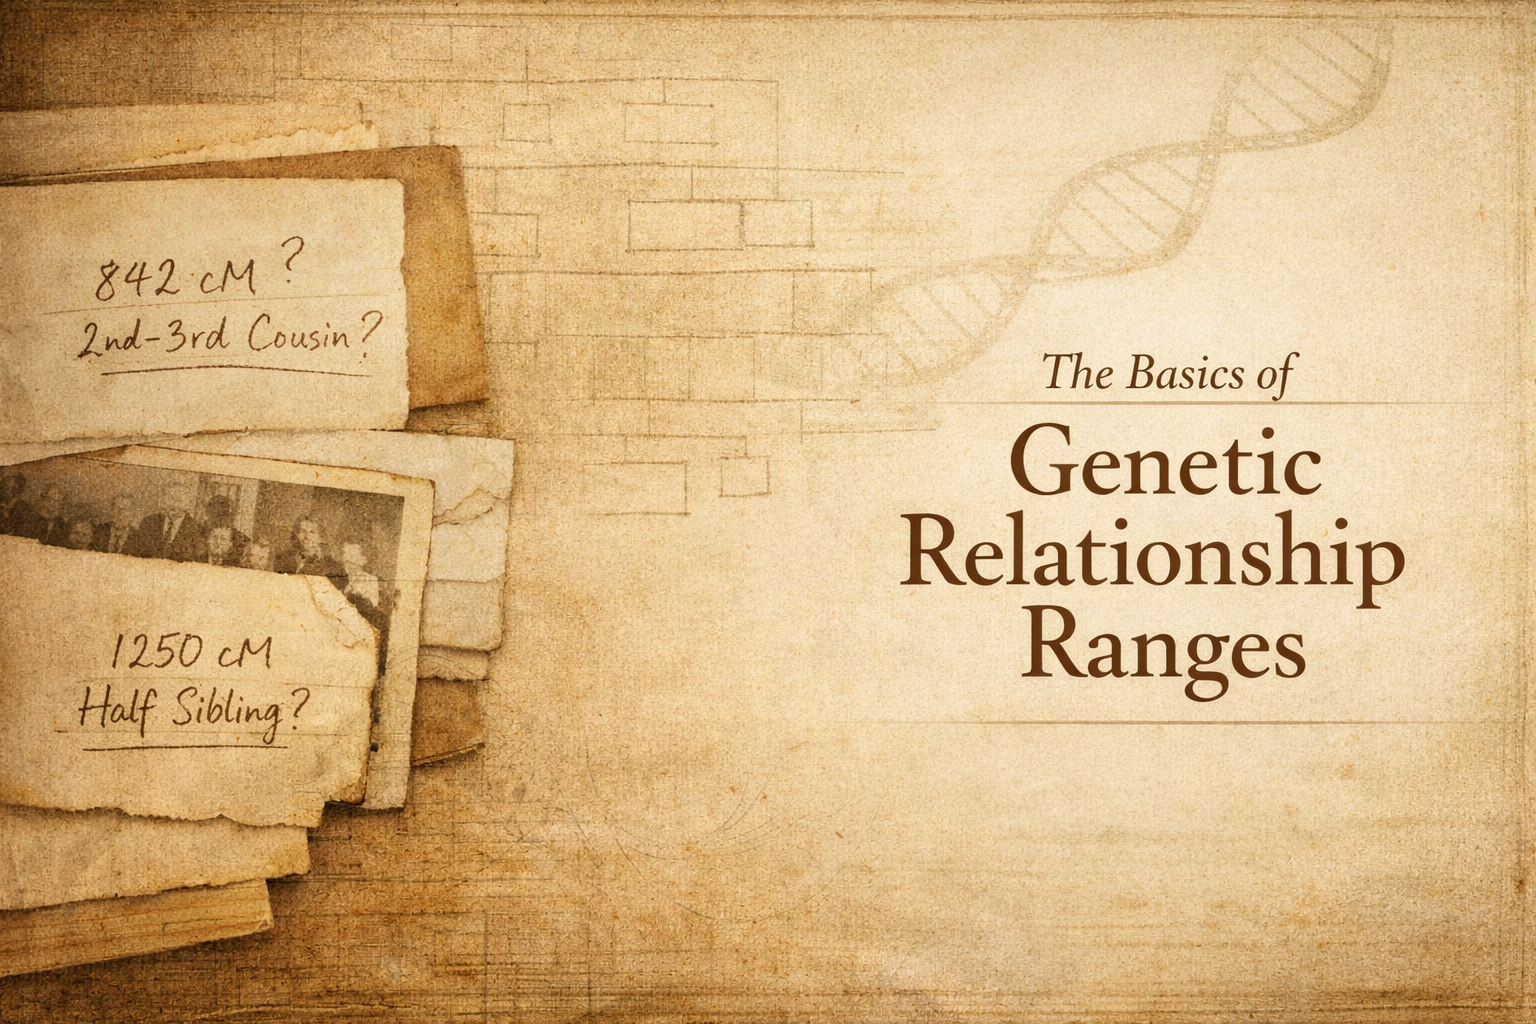
There it was. A neat little number. 842 cM. It felt precise. Scientific. Almost authoritative.
And yet, it told me almost nothing about who that person actually was.
If you’ve taken a DNA test and found yourself squinting at centimorgans and predicted relationships, you’re not alone. Genetic genealogy can feel mathematical at first glance. But behind every number is a person. A grandparent. A cousin you never met. A branch of the family that quietly drifted.
Today, we’re going to slow this down and talk about what genetic relationship ranges really mean, why they vary, and how to use them wisely in your research.
What Is a Centimorgan, Really?
A centimorgan (cM) is a unit that measures how much DNA you share with someone. It doesn’t measure physical distance in inches or base pairs. Instead, it reflects the likelihood that a segment of DNA will be inherited together.
In simpler terms:
The higher the total shared centimorgans, the closer the biological relationship is likely to be.

A parent and child share about 3,400 cM.
Full siblings share roughly 2,300–2,800 cM.
A second cousin? Often somewhere around 200–400 cM.
But here’s the part that surprises most people.
Those numbers are ranges.
Why Relationship Ranges Overlap
DNA inheritance is random. Each time DNA passes from parent to child, it is shuffled. This process, called recombination, means siblings do not inherit identical portions of their parents’ DNA.
Because of that randomness, two people with the same relationship can share different amounts of DNA.
For example:
- A first cousin might share 575 cM.
- Another first cousin might share 1,100 cM.
- A half aunt could share an amount similar to a grandparent.
The numbers can overlap across categories.

The Shared cM Project, led by genetic genealogist Blaine Bettinger, gathered thousands of real-world data points from test takers. It shows just how wide these ranges can be. That research reminds us that DNA does not hand us neat labels. It gives us probabilities.
So when your testing company predicts “2nd–3rd Cousin,” it isn’t being vague. It is being statistically honest.
Why This Matters in Family History
Let’s imagine you match someone at 680 cM.
The testing company suggests:
- Half first cousin
- First cousin once removed
- Great aunt/uncle
- Great niece/nephew
That’s a lot of possibilities.
If you treat the prediction as a fixed answer, you may build the wrong branch onto your tree. I’ve seen it happen. A well-meaning researcher attaches a match as a second cousin, only to discover years later that the relationship was actually through a half-sibling line.
When we misunderstand ranges, we risk reshaping someone’s story inaccurately.
But when we understand them?
We gain a powerful tool.
DNA becomes a guide, not a verdict.
How to Interpret Genetic Relationship Ranges Wisely
Here’s how I approach a new match.
Start with the Range, Not the Label
Ignore the testing company’s bolded relationship suggestion at first. Instead:
- Look at the total shared centimorgans.
- Check how many segments are shared.
- Compare the number to a reliable range chart.
Think in terms of possibilities, not conclusions.
Layer in Age and Generation Clues
Is your match 75 years old while you’re 35?
That likely rules out “first cousin” and shifts the probability toward a generational difference, like great aunt or grandparent-level.
Context narrows ranges beautifully.
Build Trees Forward and Backward
When I worked with a client who matched someone at 1,250 cM, the company predicted half sibling. The ages didn’t align. After building out collateral lines, we discovered the match was actually a previously unknown aunt.
The centimorgans weren’t wrong. We simply needed the tree to interpret them.

Common Relationship Ranges (Approximate)
Below is a simplified overview based on aggregated Shared cM Project data. Remember, these are ranges, not guarantees.
- Parent/Child: ~3,400 cM
- Full Sibling: ~2,300–2,800 cM
- Grandparent/Grandchild: ~1,200–2,300 cM
- Aunt/Uncle/Niece/Nephew: ~1,200–2,300 cM
- First Cousin: ~575–1,330 cM
- Second Cousin: ~75–360 cM
Notice how some categories overlap significantly.
That overlap is where careful research matters most.
A Quick Story from My Own Research
A few years ago, I matched a woman at 312 cM. The testing site predicted “2nd–3rd Cousin.” I initially assumed we descended from my great-grandparents.
We didn’t.
After weeks of comparing shared matches and building out her tree, we found the connection through my great-great-grandfather’s second marriage, a line I had barely researched.
Without understanding relationship ranges, I would have missed an entire branch of half relatives.
And those people were not statistical anomalies. They were farmers, teachers, a piano tuner in Kansas. They mattered.
What Genetic Ranges Cannot Tell You
It’s worth saying gently: DNA cannot explain family context on its own.
It will not tell you:
- Whether a relationship came from an adoption
- Whether there was an informal name change
- Whether a grandparent raised a sibling as their own
- Whether your family comes from an endogamous community, where people historically married within a small, close-knit population
That last point deserves a brief pause.
In endogamous populations, such as certain Ashkenazi Jewish, Acadian, Mennonite, Amish, or island communities, individuals may descend from the same ancestral couples multiple times over. Because of that repeated shared ancestry, centimorgan totals can appear artificially elevated. A third cousin may share DNA amounts more typical of a second cousin. The number is not “wrong,” but it reflects layered connections rather than a single recent relationship.
If you are researching in an endogamous line, interpretation requires extra care. Shared matches, triangulation, and documented trees become even more essential.
Records, oral history, and careful documentation still matter deeply.
Genetic genealogy works best when paired with traditional research methods. Census records. Probate files. Land deeds. Church registers. Those sources ground the DNA in lived reality.
A Balanced Perspective
It’s tempting to see DNA as definitive. After all, it feels scientific. Precise. Modern.
But genetic relationship ranges are probability distributions shaped by recombination and inheritance patterns studied across thousands of testers. They are evidence-based tools, not verdicts.

Used thoughtfully, they can:
- Confirm suspected connections
- Reveal unknown branches
- Help adoptees identify biological relatives
- Clarify half-relationships
Used carelessly, they can lead to assumptions that ripple through a tree.
Our ancestors deserve careful handling.
Why This Conversation Matters
Family history is not just about filling charts. It is about understanding how people were connected in real life.
When you understand genetic relationship ranges, you approach your matches with humility. You ask better questions. You resist attaching someone prematurely.
And sometimes, you discover an unexpected aunt who has been wondering about you too.
That is the quiet gift of learning the basics.
Ready to Practice?
Next time you log into your DNA match list:
- Pick one match.
- Write down the total shared cM.
- Look up the possible relationship range.
- List every plausible option before building your tree.
Let curiosity lead instead of assumption.
If you’d like a downloadable centimorgan worksheet or help interpreting a specific match, leave a comment or reach out through Echoes of Kin Genealogy. I would love to explore it with you.
Because behind every range is a real person.
And every person deserves to be understood carefully.
Leave a Reply